Laser scans in the forest: measuring CO₂ between red beeches and deadwood
- January 26, 2026
- 4 min. Reading time

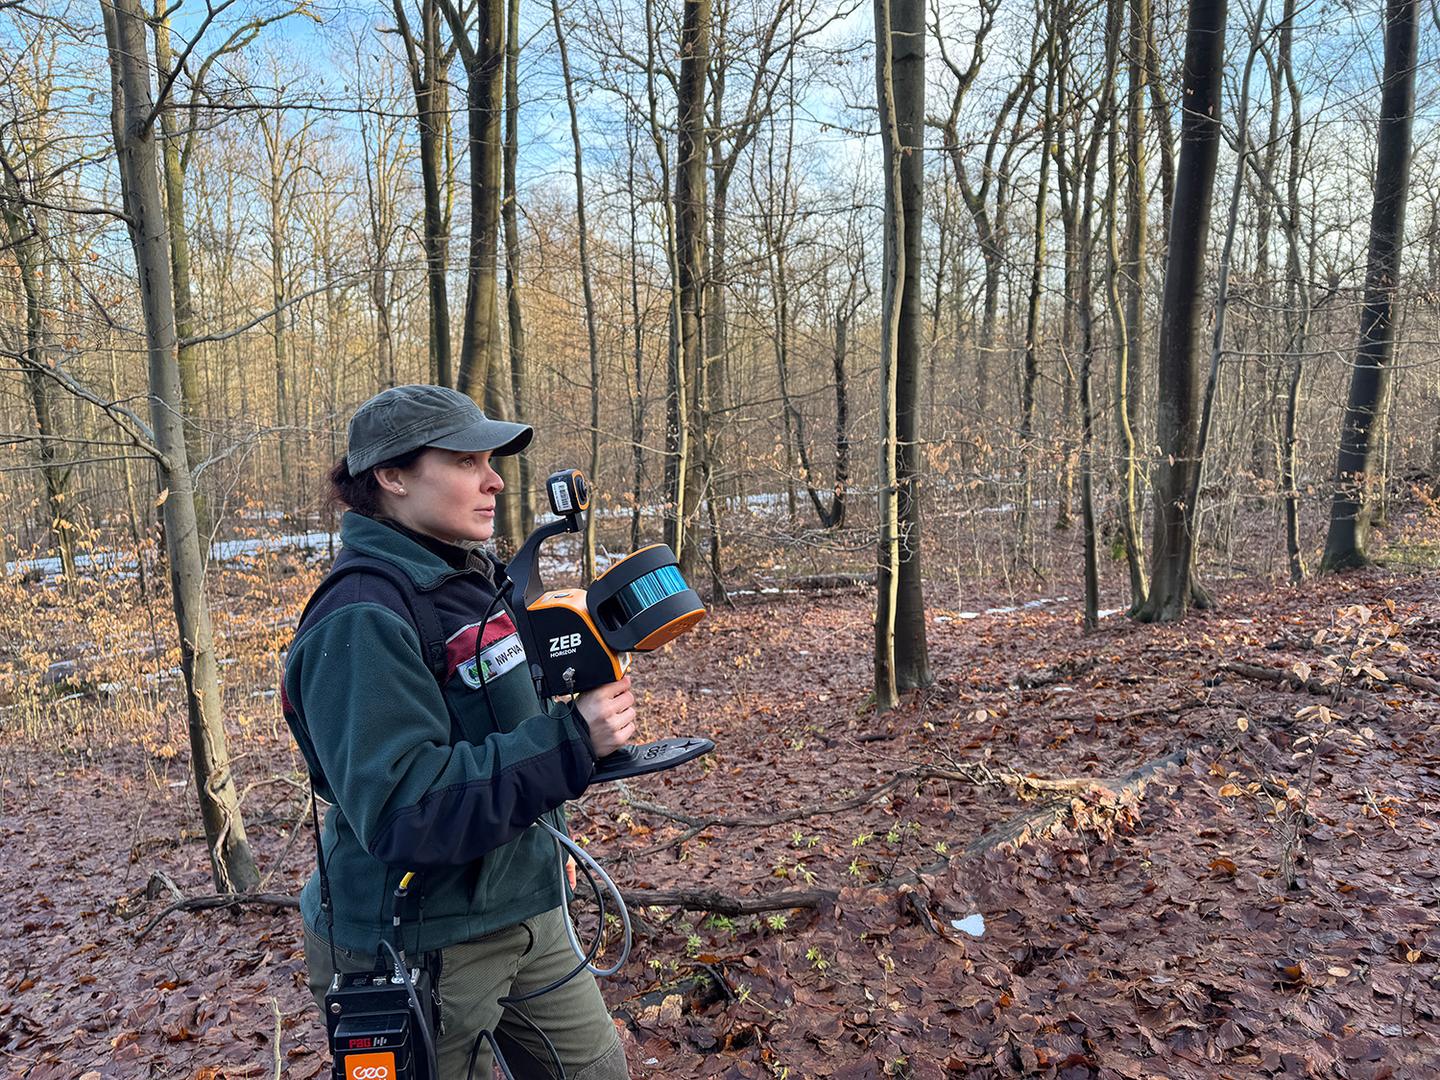
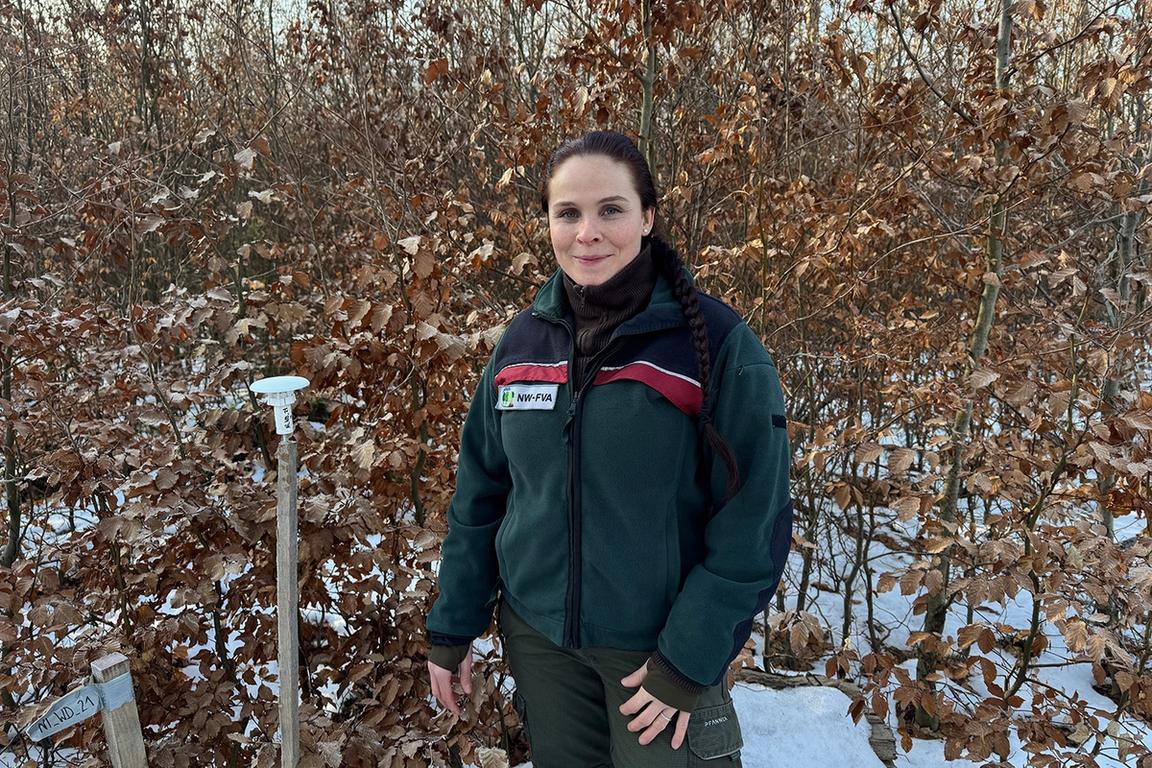
It is shortly before ten o'clock in the morning in a wooded area near Königslutter. The forest path is still completely icy, but the forest floor is free of snow except for a few patches. The thermometer reads 8 °C, the air is clear, and not a leaf is moving. These are excellent conditions for Dr. Sandra Peters to take laser scanner images here today.
Scanning through 1,000 square meters of forest
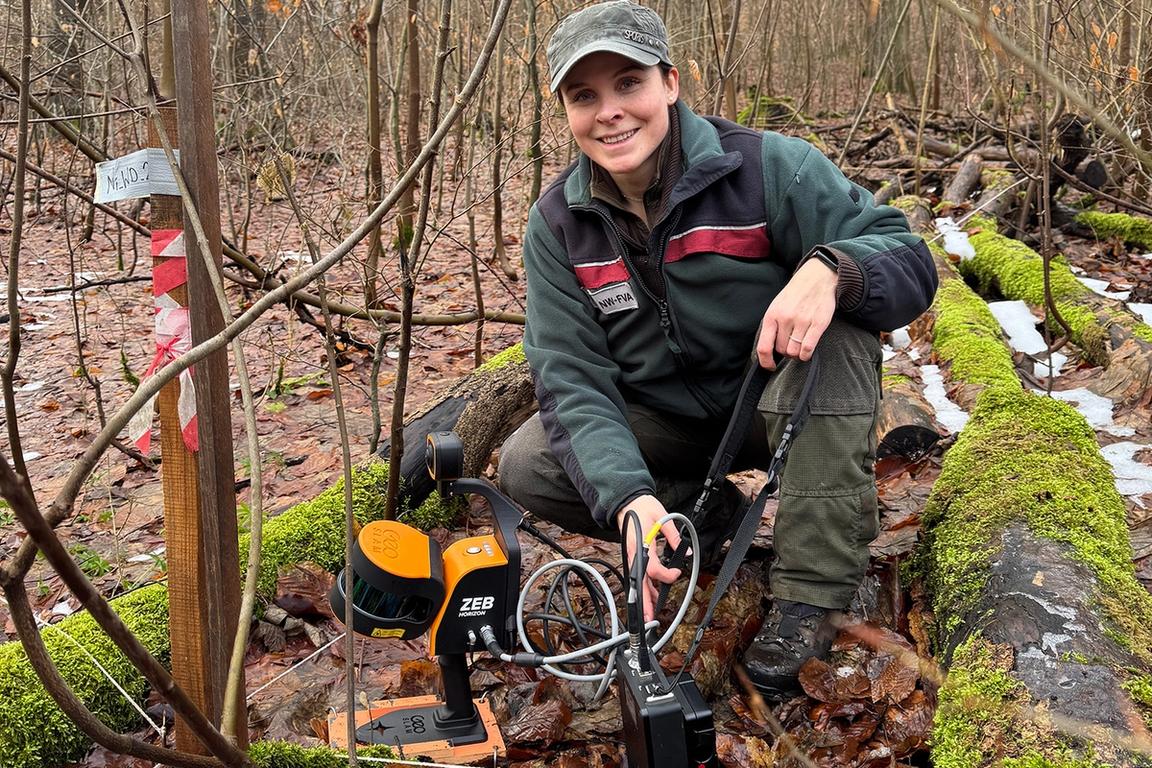
The slope is mainly covered with red beeches: older trees, but also many young trees, growing close together. The second plot, i.e., the study area she wants to survey today, is located in terrain that is not easily accessible in all places. On one side, for example, a fallen tree with a spreading crown blocks the path. But this trunk, along with all its branches, is also part of the study – dead wood that must be recorded in its entirety.
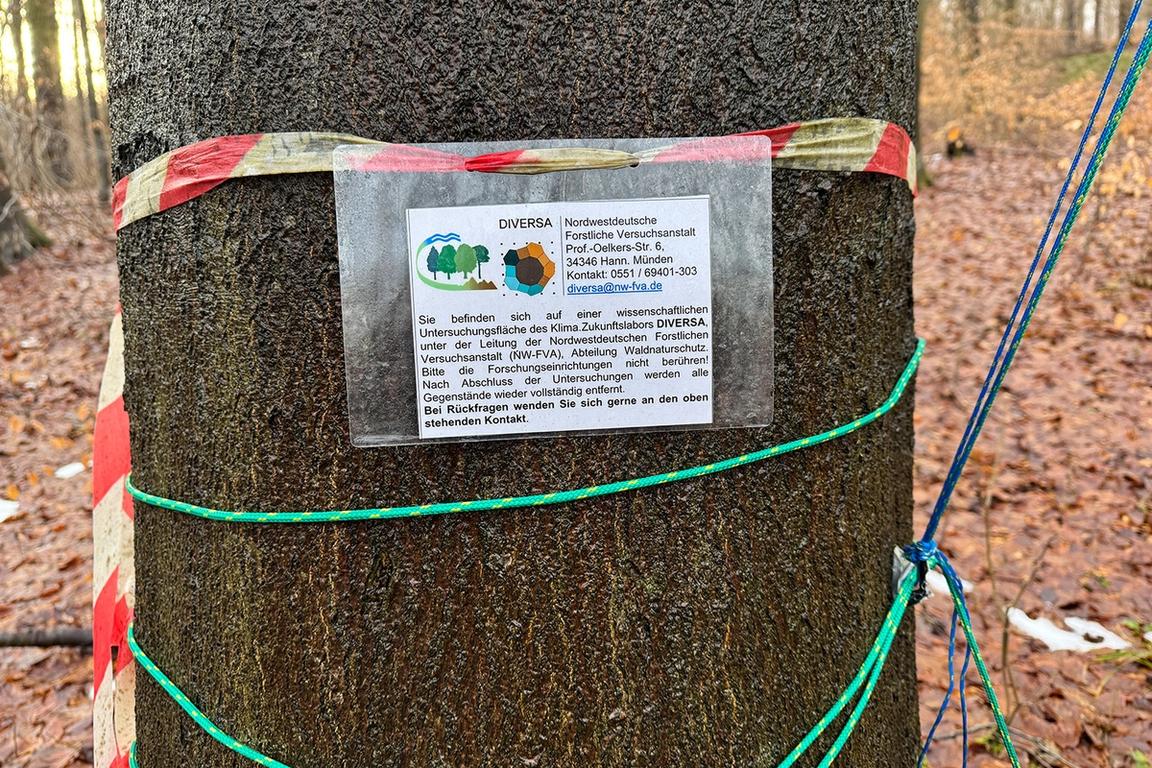
First, the study area is marked out: a sample circle of 1,000 square meters, marked with four thin strings, almost invisible to the scanner, in each direction. Sandra Peters carefully climbs over the trunk, pushes her way through the large branches, and squeezes past the many narrow twigs of the young trees. She then moves within this sample circle with the laser scanner in her hand through the rough terrain, taking care to ensure that the scanner is not damaged by branches that snap back. She walks in circles across the forest floor and records the structure of the forest from all perspectives.
Three-dimensional forest mapping on 64 plots in Lower Saxony
Dr. Sandra Peters works at the Northwest German Forest Research Institute. She is the coordinator of the DIVERSA Climate Future Lab, where she is working on the subproject “Carbon Storage in Forests.” That is precisely why she is out in the forest this morning: she is using laser scanning to capture the three-dimensional structure of the forest. The height, volume, and density of trees and deadwood can be used to calculate the biomass and, in turn, how much CO₂ is stored in a forest. There are a total of 64 such study areas, known as plots, located mainly in eastern Lower Saxony.
Measurements can only be taken in ideal weather conditions
To ensure that the results are as comparable as possible, all plots must be measured in the same season and, in this case, only when the trees are bare, i.e. between December and March. This is not so easy, as the measurements can only be taken under certain weather conditions. There must be no wind. If the wind speed exceeds 10 km/h, the tree crowns move too much for accurate recording. In addition, it must not rain, snow, or be foggy, as the laser beams would otherwise hit the particles in the air. To prevent the scanner from being damaged by condensation inside, the temperature must not fall below 0 °C. Snow is an additional challenge on this day. Too much snow on the ground is also a no-go: it distorts the measurement of the ground height, and too much dead wood lying under the snow cover remains hidden from the laser scanner. On the third plot visited that day, the measurement is therefore canceled.
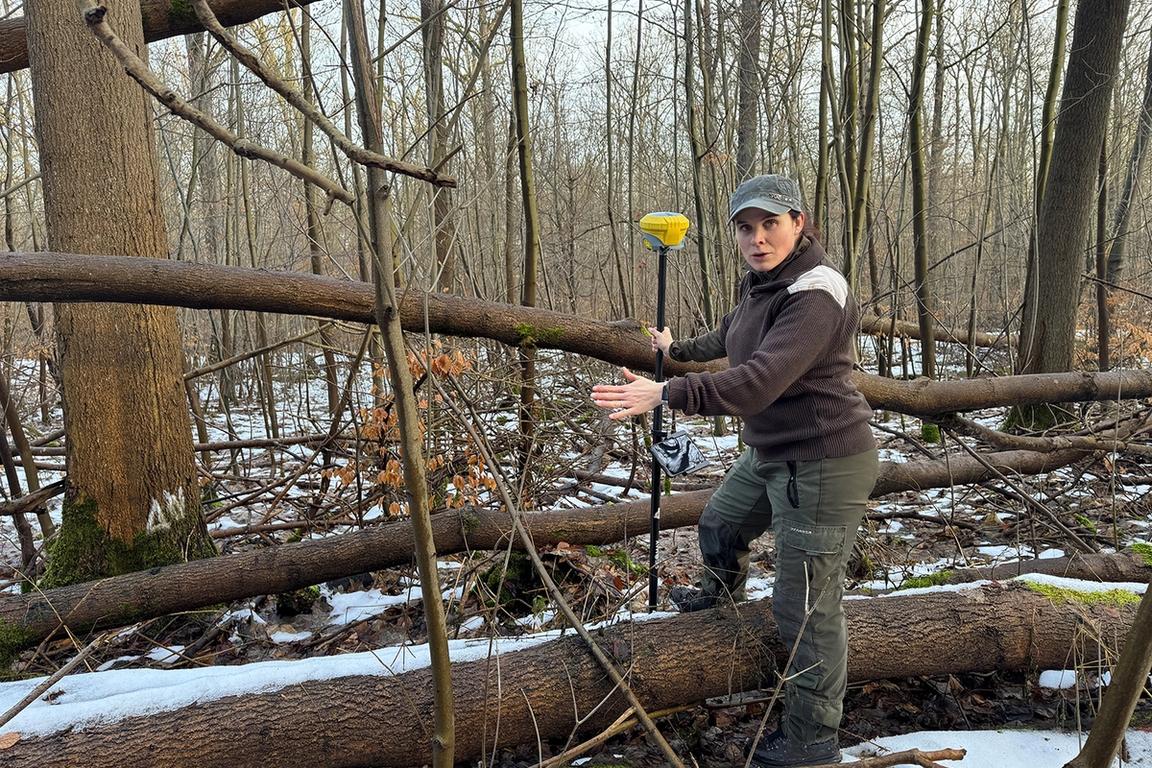
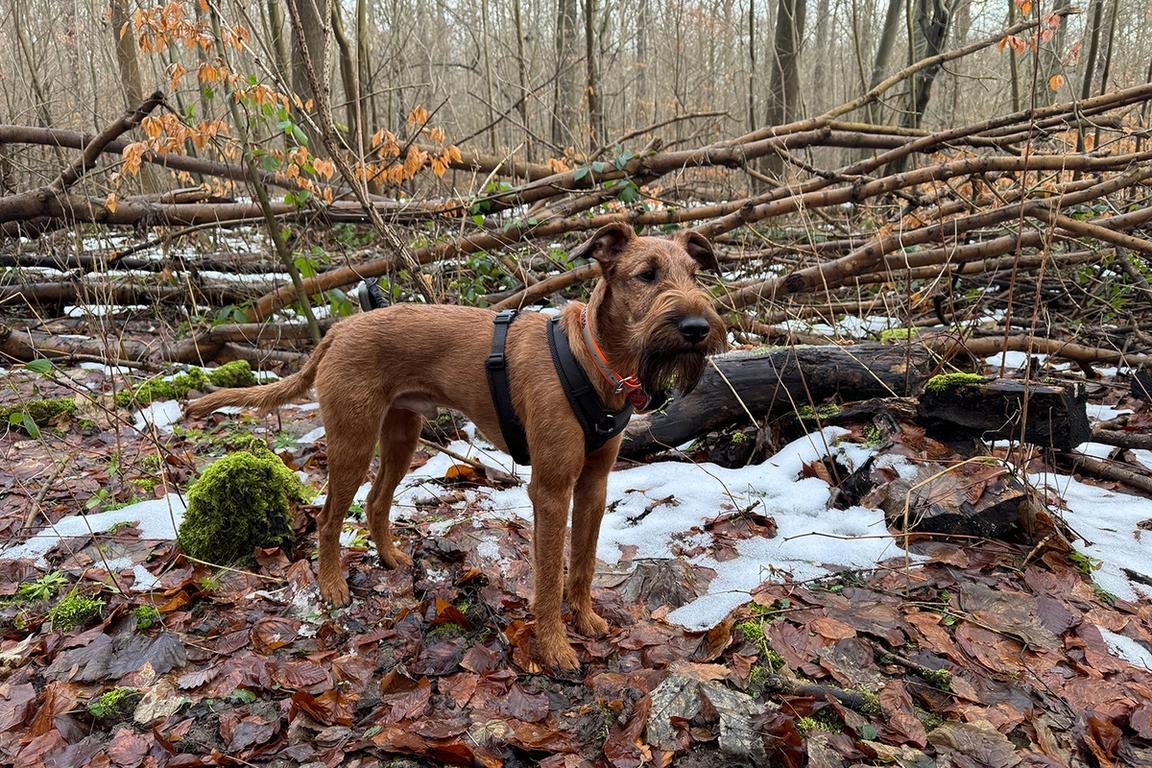
Back on the second plot, the measurements continue. Hector, Sandra Peter's dog, waits patiently outside the sample circle and watches over the equipment. He sits there quietly while his owner does her work with the scanner. Around 20 minutes later, this part of the recording is complete. Next, precise coordinates must be taken at at least four points on the study area so that the digital image of the forest can later be displayed spatially correctly and inserted into a map, for example. To do this, Sandra Peters sticks a long rod with the GPS device into the ground, exactly at the reference points where the scanner stations were previously set up.
Because the terrain is not easy to survey, as reception is poor and the GPS device needs a lot of time to obtain exact coordinates, it is now already after 12 noon. This means less time for the other plots that Sandra Peters wants to complete that day, i.e., drive to and survey. But waiting for the GPS device is pleasant because it is quiet and idyllic here. The sun is shining, the birds are chirping. Bird calls and moth populations are also studied and evaluated year-round at the 64 plots. But that's another equally interesting story, which we'll follow up on later.
After another half hour, all the GPS data has been recorded. The equipment is packed up – strings, scanner stat
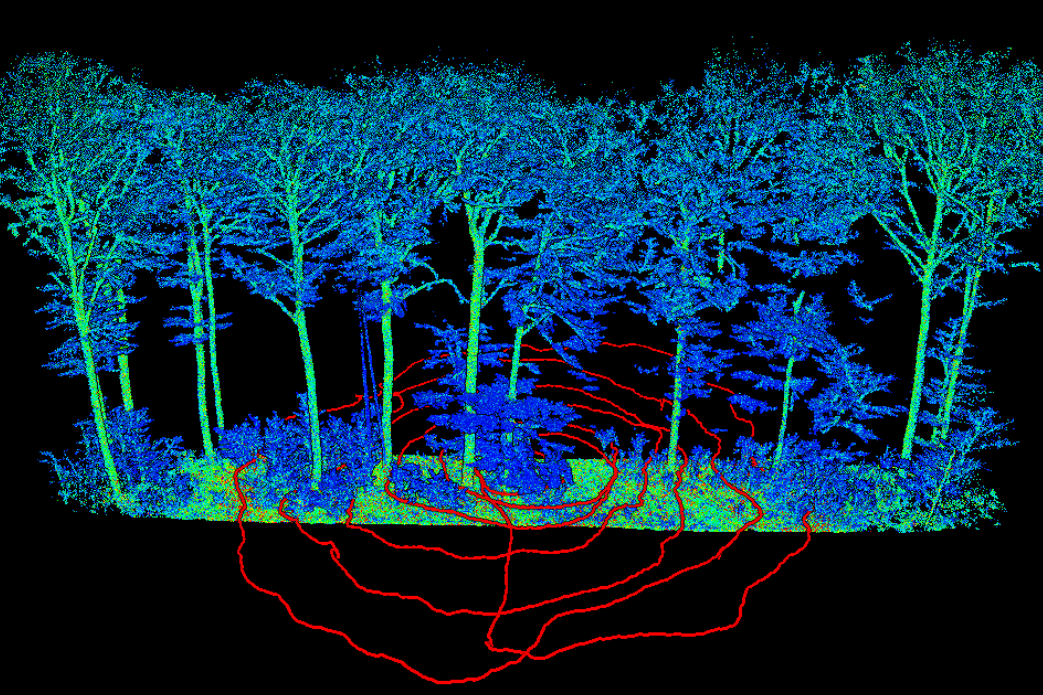
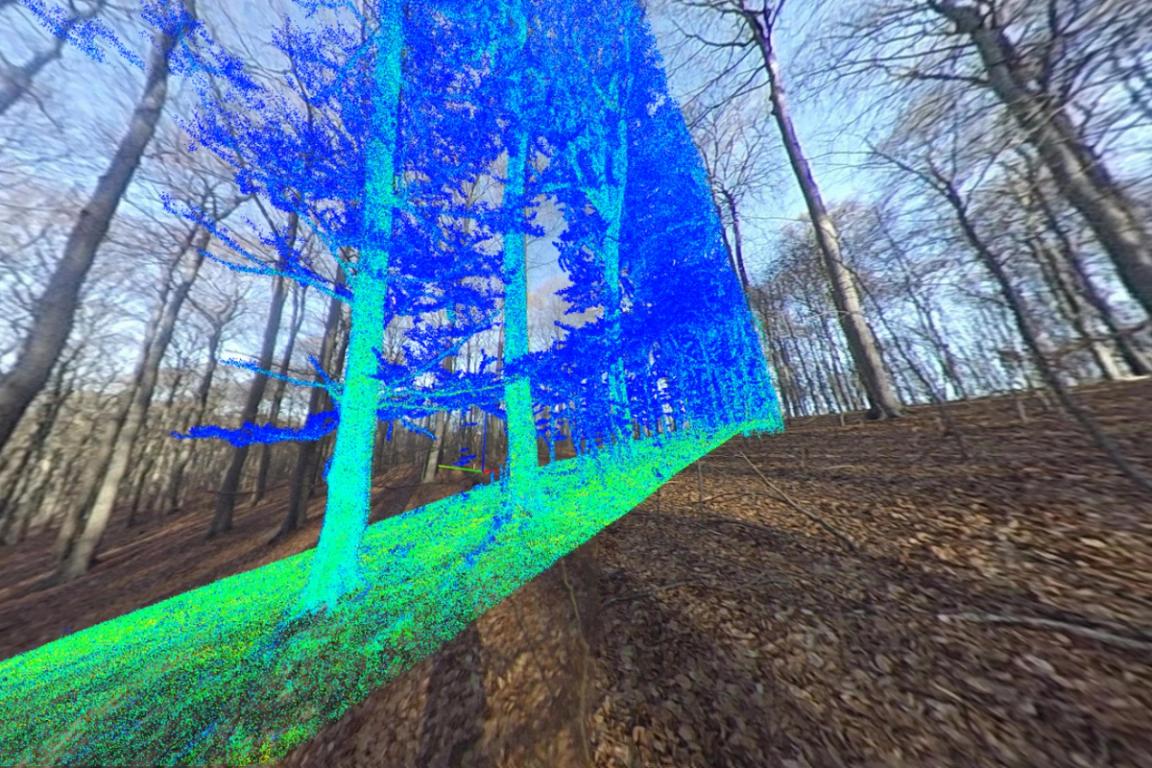
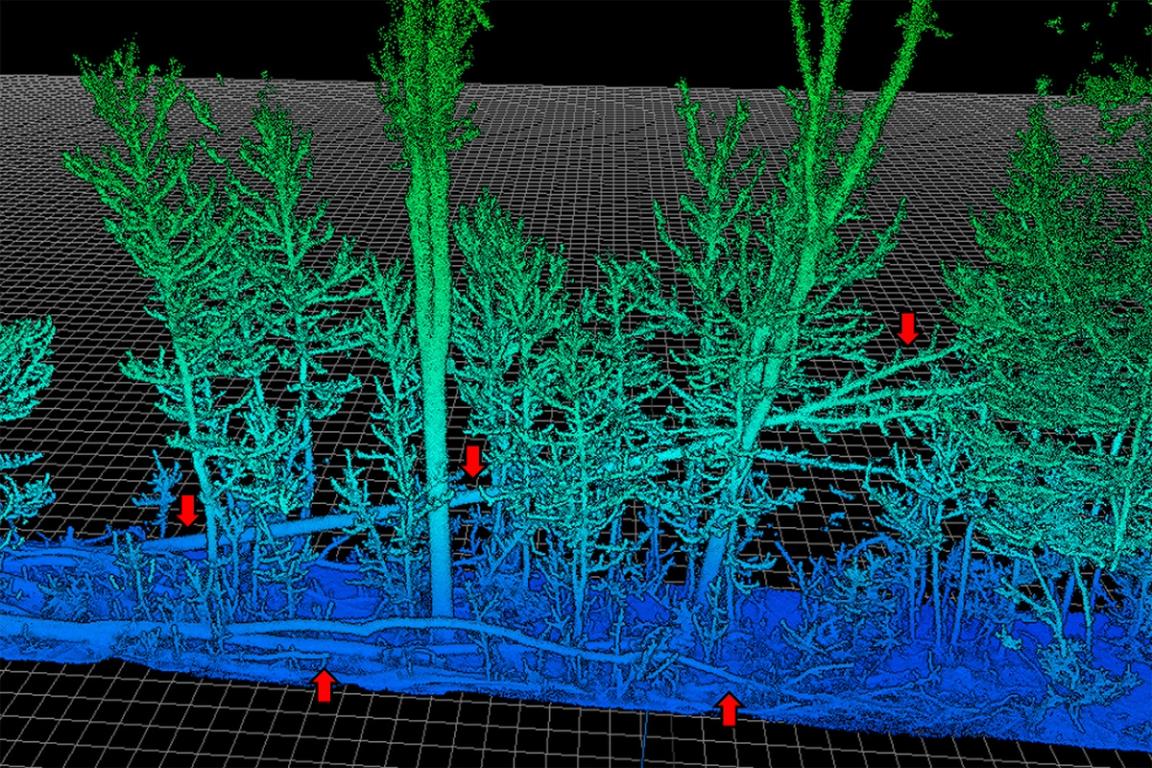
From the forest to point cloud
Back at the Northwest German Forest Research Institute in Hann. Münden, Sandra Peters evaluates the data from the laser scan. Dense point clouds and colored structures appear on the screen. Depending on what needs to be analyzed, individual sections or the entire image can be called up. The quiet scene in the forest is transformed into a digital image of its structure. Among other things, this can be used to calculate how much biomass lies or stands on the sample circle and thus also how much CO₂ is stored in this section of forest. But this is only one of numerous analysis options that the digital image of the forest can offer.
Insights into the laser scanning method


More Posts
All
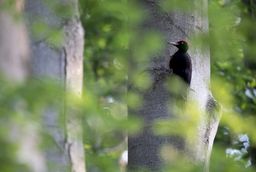
Is the black woodpecker endangered in Lower Saxony due to the loss of coniferous wood caused by calamities?
A guest contribution by Dr. Marcus Schmidt and David Singer from the Northwest German Forest Research Institute
3 min. Reading time
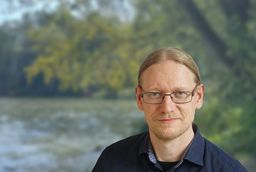
Taking a holistic approach to climate adaptation in cities
Interview with UMEX-HOPE speaker Prof. Dr. Björn Maronga
7 min. Reading time
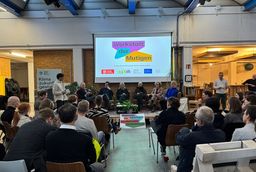
Big visions, but quick small steps
Social sustainability arises when different actors take responsibility, act together, and combine big visions with concrete, small steps.
4 min. Reading time